Full text loading...
The land surface comprises the smallest areal fraction of the Earth system's major components (e.g., versus atmosphere or ocean with cryosphere). As such, how is it that some of the largest sources of uncertainty in future climate projections are found in the terrestrial biosphere? This uncertainty stems from how the terrestrial biosphere is modeled with respect to the myriad of biogeochemical, physical, and dynamic processes represented (or not) in numerous models that contribute to projections of Earth's future. Here, we provide an overview of the processes included in terrestrial biosphere models (TBMs), including various approaches to representing any one given process, as well as the processes that are missing and/or uncertain. We complement this with a comprehensive review of individual TBMs, marking the differences, uniqueness, and recent and planned developments. To conclude, we summarize the latest results in benchmarking activities, particularly as linked to recent model intercomparison projects, and outline a path forward to reducing uncertainty in the contribution of the terrestrial biosphere to global atmospheric change.
Article metrics loading...
Full text loading...
Literature Cited
Data & Media loading...
Supplemental Material
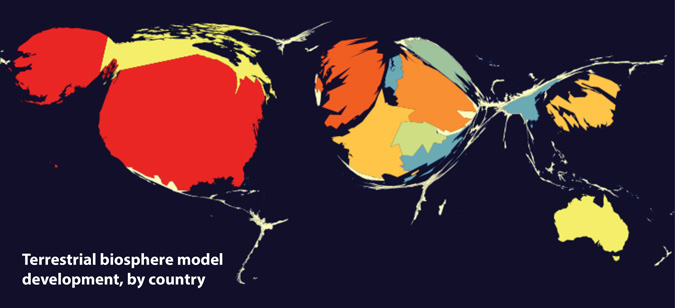
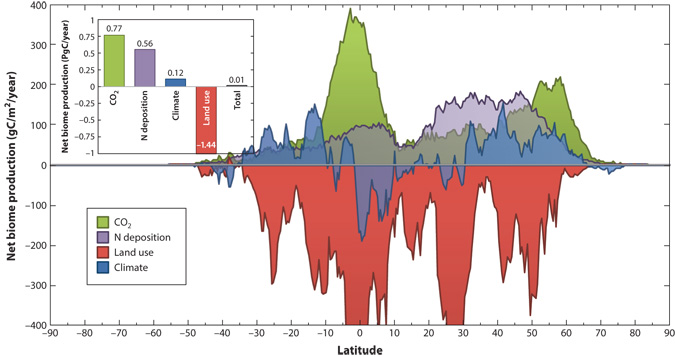
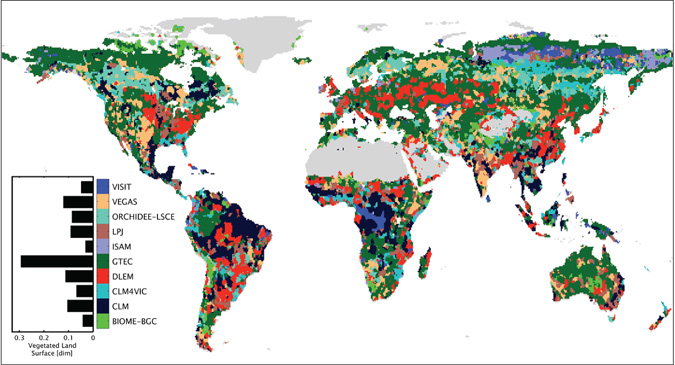
Download all Supplemental Material as a single PDF. Includes Supplemental Figures 1-3 (also reproduced below) and Supplemental Table 1. Supplemental Figure 1. The United States and Europe have developed a disproportionately large number of terrestrial biosphere models (TBMs). This cartogram skews the country size by the number of TBMs developed, as defined by the country address of the corresponding author on the first reference for each respective TBM shown in Supplemental Table 1. Supplemental Figure 2. Sensitivity of the terrestrial biosphere net biome production in the CLM4.5 model to varying CO2 (green), nitrogen (N) deposition (purple), climate (blue), and land use and land cover change (red). The effects are shown as zonal sums averaged over 1982–2010, with the global totals inset. CO2, N deposition, and climate changes in the high latitudes lead to net carbon uptake, whereas climate changes in the tropics and land use and land cover change globally lead to large carbon emissions in CLM4.5. The net integral of all drivers globally produce a total of 0.01 PgC/year uptake. Supplemental Figure 3. Spatial distribution of the best performing model for any given grid cell from models participating in the MsTMIP model intercomparison.