Full text loading...
Ventricular arrhythmias have complex causes and mechanisms. Despite extensive investigation involving many clinical, experimental, and computational studies, effective biological therapeutics are still very limited. In this article, we review our current understanding of the mechanisms of ventricular arrhythmias by summarizing the state of knowledge spanning from the molecular scale to electrical wave behavior at the tissue and organ scales and how the complex nonlinear interactions integrate into the dynamics of arrhythmias in the heart. We discuss the challenges that we face in synthesizing these dynamics to develop safe and effective novel therapeutic approaches.
Article metrics loading...
Full text loading...
Literature Cited
Data & Media loading...
Supplemental Material
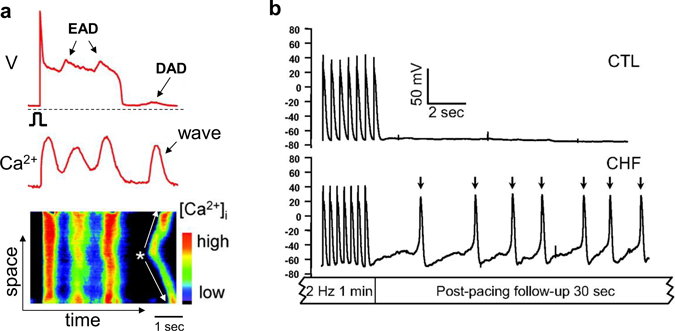
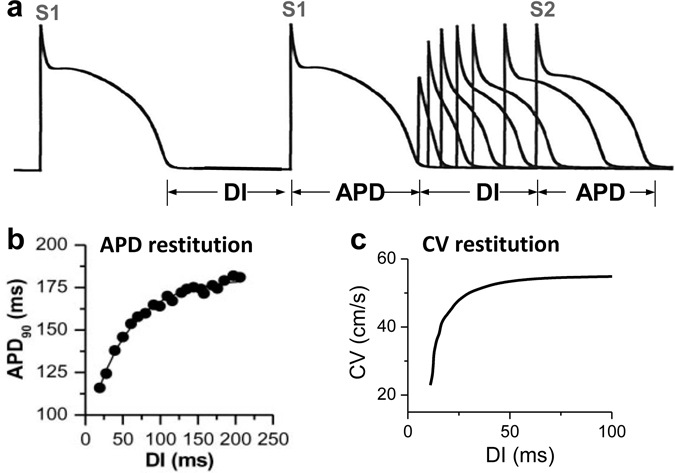
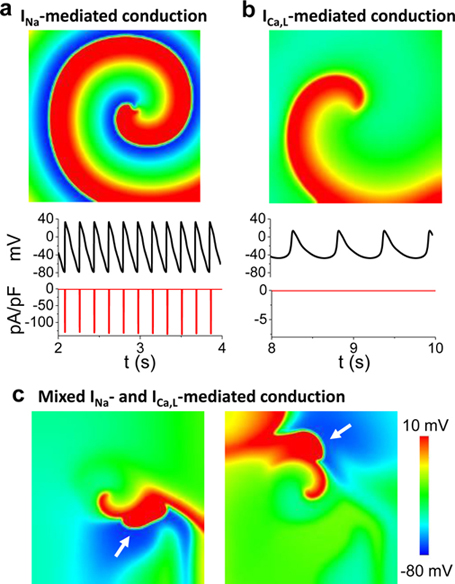
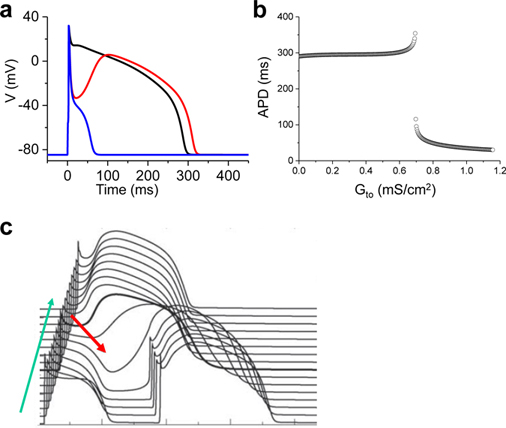
Download Supplemental Text (PDF). Download Supplemental Figures 1-6 as a single PDF (also reproduced below). Supplemental Figure 1. Complex focal excitations and reentry in tissue. a. Multiple shifting foci (stars) in a homogeneous tissue due to dynamic instabilities, in which the foci continuously disappear and reborn, shifting in space and time. b. Spiral wave breakup, in which the waves are unstable, continuously disappear and reborn through breaks of the existing ones. c. Mother-rotor fibrillation, in which a stable rotor (indicated by the arrow) emanates wavefronts which fail to be 1:1 conduction due to heterogeneities in refractoriness, resulting in wavebreaks away from the rotor. d. Scroll wave breakup in in three-dimensional tissue slab. e. Scroll wave breakup in a model of dog ventricles. The panels shown are voltage snapshots from computer simulations, with voltage levels indicated by the color bar. Panels a-c are simulations of two-dimensional tissue models; panel d is a simulation of a three-dimensional tissue slab; and panel e is a simulation of a dog ventricle model. The left panel in e is a voltage snapshot of the heart surface and the right panel is voltage snapshot of the entire ventricle in which voltage higher than a certain value is colored red (otherwise no color) for three-dimensional visualization. Supplemental Figure 2. Restitution and alternans. a. Voltage traces showing the protocol used for measuring S1S2 APD restitution curve, i.e., a train of S1 stimulus with a certain cycle length is applied to pace the cell into a steady state and then an S2 stimulus is applied for a certain S1S2 interval. The same pacing protocol is repeated with different S1S2 intervals which give rise to different diastolic intervals (DIs) preceding the S2 stimulus and APDs of S2 beat. By plotting APD against the preceding DI, one obtains the S1S2 APD restitution curve. b. An S1S2 APD restitution curve (APD vs preceding DI) from a rabbit ventricular myocyte. c. Conduction velocity (CV) restitution curve (CV vs preceding DI) which can be measured using a similar protocol as the S1S2 APD restitution curve but needs to be carried out in tissue. Supplemental Figure 3. Bi-excitability. a. An INa-mediated spiral wave in which the voltage recovers fully to around -80 mV after each excitation (black trace) and INa is activated to generate the upstroke (red trace). Note that the color changes from blue to red in the voltage snapshot. b. In the same tissue as in a, a different initiation protocol produces an ICa,L-mediated spiral wave, in which the voltage recovers only partially to around -50 mV (black trace) and the upstroke is mediated by ICa,L without INa activation (red trace). Note that the color changes from green to red in the voltage snapshot. c. Two snapshots showing mixed INa- and ICa,L-mediated conduction (different parameter settings from a and b). White arrows point to INa-mediated conduction. All computer simulations are from homogeneous two-dimensional tissue models (From Chang et al, Ref.28 with permission), indicating that the patterns are dynamic in origin and do not require pre-existing heterogeneity. Supplemental Figure 4. Spike-and-dome action potential morphology initiating phase-2 reentry. a. Action potentials with no Ito (black), intermediate Ito (red), and large Ito (blue). b. APD versus Ito conductance. c. Phase-2 reentry (modified from Ref. 107). Green arrow indicates the direction of a pacing beat. Red arrow indicates that the AP dome in the upper region re-excites the repolarized cells near the middle, which then propagates retrogradely, resulting in phase-2 reentry. Supplemental Figure 5. EAD dynamics. a. Voltage traces showing a 1 ms delay in S2 stimulus from an S1 action potential result in an EAD (red trace). b. APD restitution in the presence of EADs. The steep and discontinuous change in the APD restitution curve is caused by the all-or-nothing property shown in a. c. APD vs. beat number showing a chaotic behavior. The result was obtained by iterating the following equation: Supplemental Figure 6. DADs. a. A DAD (arrow) caused by a spontaneous Ca2+ wave in a Ca2+-overloaded ventricular myocyte with EADs (arrows), illustrating voltage (upper), whole-cell Ca2+ fluorescence (middle), and a line scan of Ca2+ fluorescence (bottom). Asterisk and the white arrows indicate the origin of the Ca2+ wave from the center of the cell and its propagation to the ends, respectively. Reproduced from Xie et al. (from Ref.89 with permission). b. Voltage traces showing pacing-induced DADs in HF cells (indicated by arrows), but not in the normal cell, reproduced from Yeh et al (from Ref.87 with permission).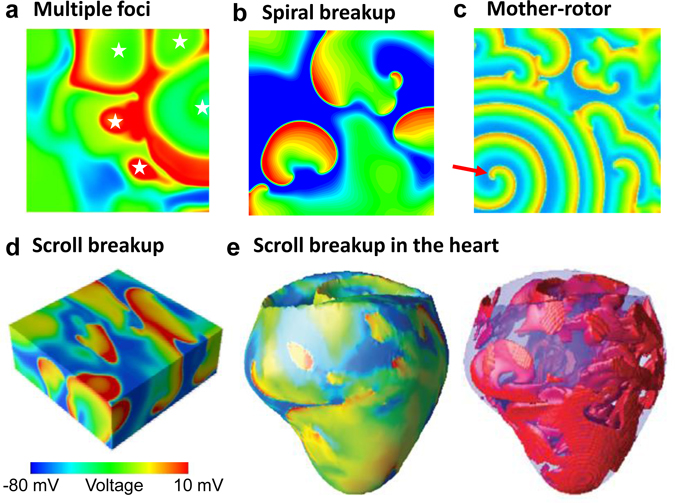
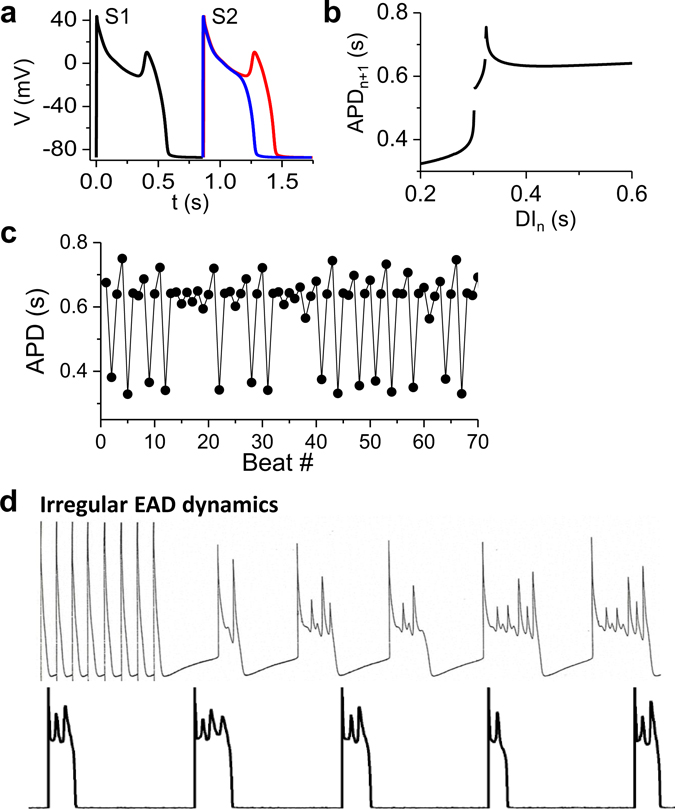
 , where PCL is the pacing cycle length and f is the restitution function from b. (From Ref.14 with permission) d. Voltage traces showing irregular EAD appearance. Upper trace is a recording from dog Purkinje fiber (Courtesy of Robert Gilmour). Lower trace is a recording from an isolated rabbit ventricular myocyte subjected to hypokalemia ([K+]o=2.7 mM) (from Ref.18 with permission).