Full text loading...
The far right party family is the fastest-growing party family in Europe. In addition to describing the ideological makeup of the far right party family, this review examines demand-side and supply-side explanations for its electoral success. Demand-side explanations focus on the grievances that create the “demand” for far right parties, whereas supply-side explanations focus on how the choices that far right parties make and the political opportunity structure in which they act influence their success. The review finishes by suggesting that far right scholars must recognize the interaction between demand-side and supply-side factors in their empirical analyses in order to draw valid inferences and that it would be productive to pay more attention to the political geography of far right support and the different stages of far right success.
Article metrics loading...
Full text loading...
Literature Cited
Data & Media loading...
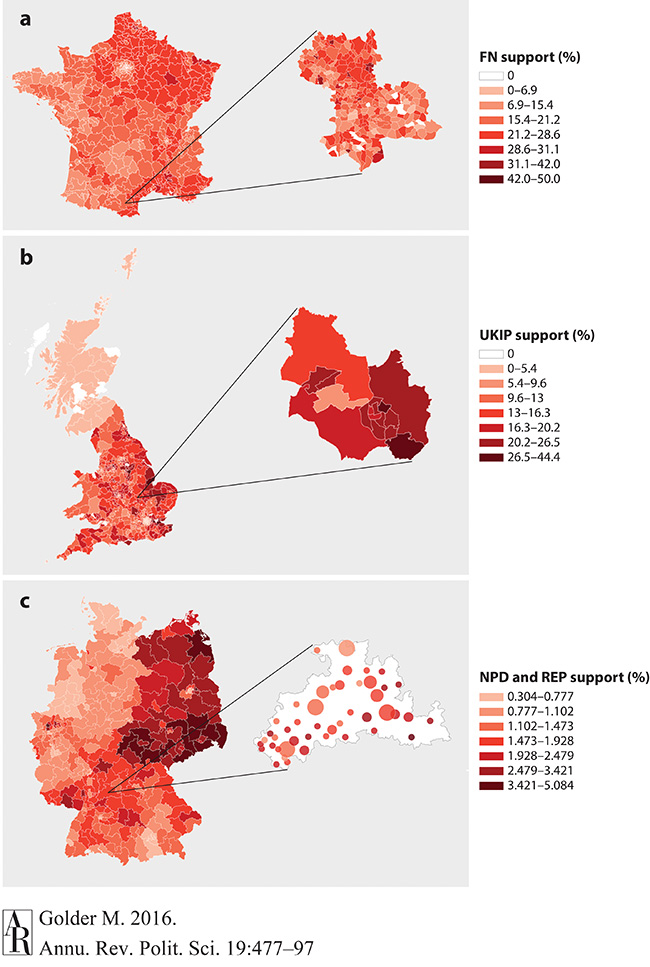
Supplemental Information on Figure 3
Figure 3 in the main text shows the geographic distribution of support for far right parties in France, the United Kingdom, and Germany. The top panel shows how the voteshare for the National Front (FN) was distributed across constituencies (left) in metropolitan France (excluding Corsica) and across communes within the third constituency of Aude (right) during the 2012 presidential elections in France. The underlying data for the French panel were kindly provided by Martial Foucault, Director of CEVIPOF. The middle panel shows how the voteshare for the United Kingdom Independence Party (UKIP) was distributed across constituencies (left) in the United Kingdom (excluding Northern Ireland) and across wards within the Kettering constituency (right) during the 2015 legislative and local elections in the United Kingdom; these elections occurred on the same day. The data for the constituecy and ward boundaries are from the Ordnance Survey (https://goo.gl/3eM6Ln). The data for the constituency-level UKIP support are from Election Resources on the Internet (http://goo.gl/NS5sZM), while the data for ward-level support are from the Kettering Borough Council (http://goo.gl/4mPyO6). The bottom panel shows how the combined voteshare for the National Democratic Party (NPD) and the Republikaner (REP) was distributed across constituencies (left) and across municipalities within the Odenwald-Tauber constituency during the 2013 legislative elections in Germany; the circles representing the municipalities are drawn in proportion to the size of the voting population in each municipality. The data for the constituency boundaries come from http://goo.gl/Jlpe3H and the data for municipality locations come from Google Maps (http://goo.gl/jDuucd). The data for the constituency-level NPD and REP support are from the German Federal Returning Officer (http://goo.gl/6TmaJU), while the data for the municipal-level support and voting population size are from the Baden-Württemberg Statistical Office (http://goo.gl/YtVYns).