Full text loading...
We use cookies to track usage and preferences.I Understand
Psychophysical experiments on feature tracking suggest that most of our sensitivity to chromatic motion and to second-order motion depends on feature tracking. There is no reason to suppose that the visual system contains motion sensors dedicated to the analysis of second-order motion. Current psychophysical and physiological data indicate that local motion sensors are selective for orientation and spatial frequency but they do not eliminate any of the three main models—the Reichardt detector, the motion-energy filter, and gradient-based sensors. Both psychophysical and physiological data suggest that both broadly oriented and narrowly oriented motion sensors are important in the early analysis of motion in two dimensions.

Article metrics loading...

Full text loading...


Data & Media loading...
| a | b | c |
 |
 |
 |
| d | e | f |
 |
 |
 |
Figure 1. Moving contrast and luminance patterns (upper panels) and space-time plots of their motion (lower panels).
a. A sinusoidal grating - a luminance pattern widely used for studying linear filtering processes.
b. A typical second-order stimulus, a contrast modulated, high spatial frequency grating. It is the product of a stationary high spatial frequency luminance grating (known as the carrier), which remains stationary, and a moving sinusoidal modulation (the envelope), which causes the contrast of the carrier to vary across its surface. In this case the envelope is the sum of a dc term and a sinusoid.
c. A contrast-modulated dynamic random dot pattern. The envelope is identical to that in b but the carrier is a random dot pattern.
d. Space-time plot of a. The vertical axis is time. The plot shows a single slice across the display over time. The luminance profile moves rightwards in small steps. The reciprocal of the gradient (displacement / time) gives the speed of motion.
e. Space-time plot of b. Note that the speed is the same as in d and that the high spatial frequency grating does not move - its bars run vertically upwards. It is the contrast modulation (the envelope) that moves.
f. Space-time plot of c. Note that the envelope motion is like e but that the dot pattern changes on every frame.
| a | b |
 |
 |
| c | d |
 |
 |
Figure 3. Moving stimuli and space-time plots of the presentation modes used by Hammett et al 1993.
a. The stimulus, a beat pattern made by adding gratings with a spatial frequency ratio of 3:4.
b. The same beat pattern as a however, blank intervals have been added between frames.
c. Space-time plot of a. This stimulus causes both rightward motion visible to motion sensors (the carrier jumps rightwards as can be seen by inspecting the detail in the high contrast areas) and leftward motion of features (the contrast envelope jumps leftwards). Both of these motions are visible to observers.
d. Space-time plot of b. Adding a blank interval to each frame makes it impossible to see the motion signalled by the sensors but the motion of the envelope is still clearly detectable.
| a | b | c | d |
 |
 |
 |
 |
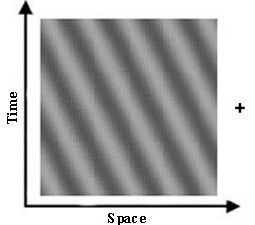
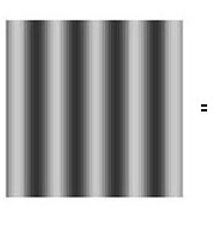
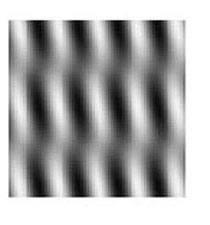
Figure 5. Space-time plots of a moving grating a, a pedestal b and their sum c. Figure 5d shows the moving stimulus.
| a | b | c | d |
 |
 |
 |
 |
| e | f | g | h |
 |
 |
 |
 |
Figure 8
Adding together the two sinusoidal gratings in a and b produces the plaid pattern shown in panels c - h. The true direction of motion of the plaid pattern - shown as a red arrow in the vector plot overlaid on the plaid in panel c - is given by the intersection of constraints (IOC). The IOC is the intersection of the two lines drawn at right-angles to, and through, the end points of the vectors representing the motion of the gratings. If presented for short durations or in peripheral vision the plaid shown in c appears to move in a direction closer to the green arrow than the red arrow. Panel d shows the moving stimulus represented in panel c. Panel e shows that this misperception could be a consequence of a failure to register the difference in the speeds of the plaid's components before calculating the IOC. The motion of the plaid in panel f can be detected when the motion of its components is undetectable. Panel g shows that the motion of the vertical edges in the plaid (blue arrow) should be much more detectable than the motion of its components. Panel h shows the moving stimulus represented in panel g.
