The full text of this item is not currently available.
Review Article
Free
Sun, Ocean, Nuclear Bombs, and Fossil Fuels: Radiocarbon Variations and Implications for High-Resolution Dating
- Koushik Dutta1
- Vol. 44:239-275 (Volume publication date June 2016) https://doi.org/10.1146/annurev-earth-060115-012333
-
© Annual Reviews
Abstract
Radiocarbon, or 14C, is a radiometric dating method ideally suited for providing a chronological framework in archaeology and geosciences for timescales spanning the last 50,000 years. 14C is easily detectable in most common natural organic materials and has a half-life (5,730±40 years) relevant to these timescales. 14C produced from large-scale detonations of nuclear bombs between the 1950s and the early 1960s can be used for dating modern organic materials formed after the 1950s. Often these studies demand high-resolution chronology to resolve ages within a few decades to less than a few years. Despite developments in modern, high-precision 14C analytical methods, the applicability of 14C in high-resolution chronology is limited by short-term variations in atmospheric 14C in the past. This article reviews the roles of the principal natural drivers (e.g., solar magnetic activity and ocean circulation) and the anthropogenic perturbations (e.g., fossil fuel CO2 and 14C from nuclear and thermonuclear bombs) that are responsible for short-term 14C variations in the environment. Methods and challenges of high-resolution 14C dating are discussed.

Article metrics loading...
/content/journals/10.1146/annurev-earth-060115-012333
2016-06-29
2025-04-07
[Citing articles]
[Web of Science]
[Medline]
Literature Cited
/content/journals/10.1146/annurev-earth-060115-012333
Sun, Ocean, Nuclear Bombs, and Fossil Fuels: Radiocarbon Variations and Implications for High-Resolution Dating
Annual Review of Earth and Planetary Sciences 44, 239 (2016); https://doi.org/10.1146/annurev-earth-060115-012333
/content/journals/10.1146/annurev-earth-060115-012333
/content/journals/10.1146/annurev-earth-060115-012333
Data & Media loading...
Supplementary Data
-
Download Supplemental Figures 1–4 as a single PDF, or see below:
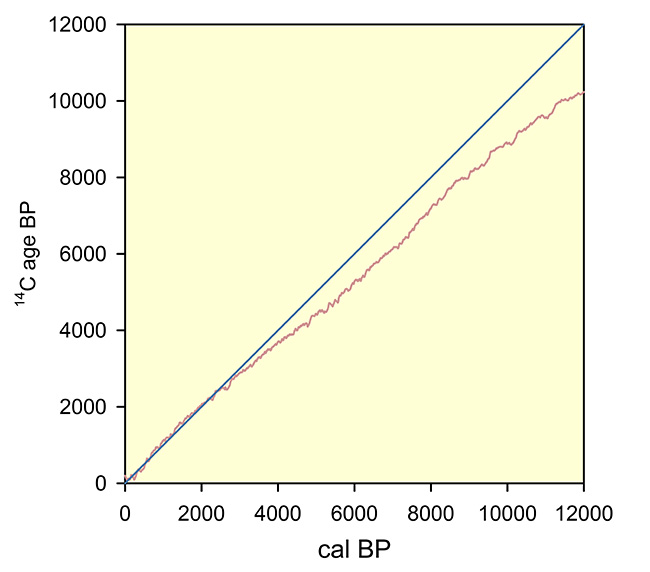
Supplemental Figure 1. IntCal13 14C calibration curve (red line; Reimer et al. 2013), showing the relationship between calendar age and 14C age for 0–12 ka BP. The deviations of the 14C calibration curve from the 1:1 line (straight blue line) illustrate the mismatch between the 14C ages and calendar ages, and result from geomagnetic and heliomagnetic variations of atmospheric 14C.
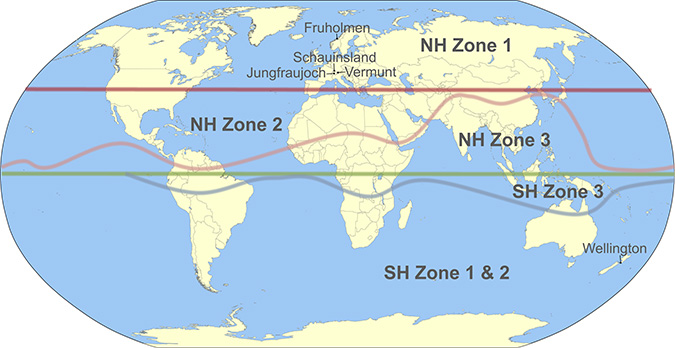
Supplemental Figure 2. Five hemispheric zones of post-bomb Δ14CO2 (Hua et al. 2013), with locations of four longest atmospheric 14CO2 measurement stations.
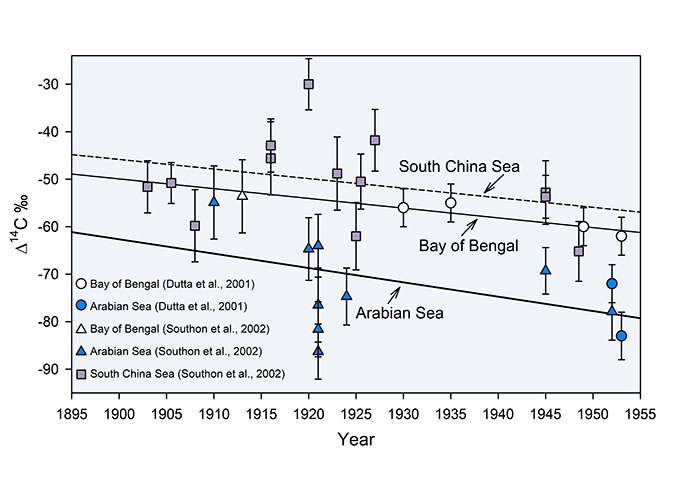
Supplemental Figure 3. Marine Suess effect in the northern Indian Ocean and South China Sea (Dutta 2008). Straight lines are the linear fits to the measured Δ14C between 1900 and 1955, indicating per decade marine 14C Suess effects of –3.0‰ ± 1.8‰ for the Arabian Sea, –2.1‰ ± 0.5‰ for the Bay of Bengal, and –2.0‰ ± 1.3‰ for the South China Sea.
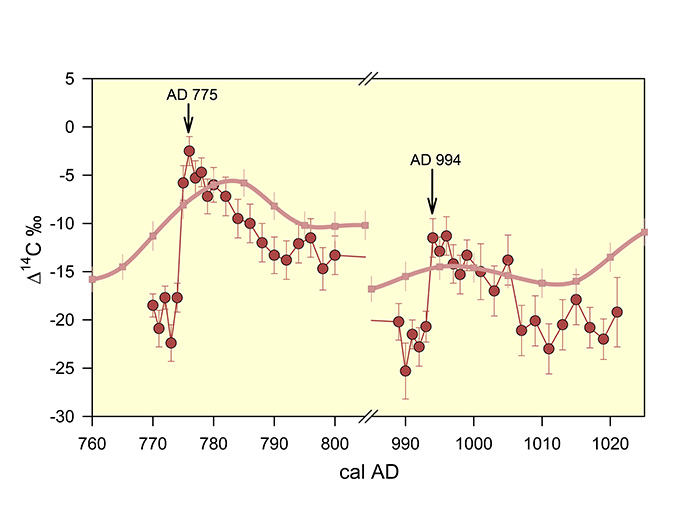
Supplemental Figure 4. 14C excursions observed in high-precision single-year tree-ring 14C data in AD 775 and AD 994 (red circles with ±1σ errors; Miyaki et al. 2014). Both events are characterized by ~15‰ rise in Δ14C within two years followed by steady decline over two decades. Thick red line is the IntCal13 calibration curve with ±1σ errors (Reimer et al. 2013).
- Article Type: Review Article
Most Read This Month
Article
content/journals/earth
Journal
5
3
false
en
Most Cited Most Cited RSS feed
-
-
Geologic Evolution of the Himalayan-Tibetan Orogen
An Yin, and T. Mark HarrisonVol. 28 (2000), pp. 211–280
-
-
-
-
-
Tectonic Implications of the Composition of Volcanic ARC Magmas
J. A. Pearce, and D. W. PeateVol. 23 (1995), pp. 251–285
-
-
-
GLOBAL GLACIAL ISOSTASY AND THE SURFACE OF THE ICE-AGE EARTH: The ICE-5G (VM2) Model and GRACE
Vol. 32 (2004), pp. 111–149
-
-
-
-
-
LABORATORY-DERIVED FRICTION LAWS AND THEIR APPLICATION TO SEISMIC FAULTING
Vol. 26 (1998), pp. 643–696
-
-
-
United Plates of America, The Birth of a Craton: Early Proterozoic Assembly and Growth of Laurentia
Vol. 16 (1988), pp. 543–603
-
-
-
- More Less